
The Buffett Indicator, which calculates the ratio of the market capitalization (MC) of a country’s publicly traded stocks to it’s gross domestic product (GDP) can provide a high level view of a country’s valuation. In 2001, Fortune published an article on the Buffett Indicator where he remarked:
“If the percentage relationship falls to the 70% or 80% area, buying stocks is likely to work very well for you. If the ratio approaches 200%–as it did in 1999 and a part of 2000–you are playing with fire,"
[Warren Buffet]
Interpretation
MCs are forward looking and price in future expected economic value; GDPs are backward looking and value the most recent actual economic activity. The ratio of MC to GDP can provide insight into whether a market is over or undervalued. Similar to Price to Earnings ratios of a specific stock, we can use it to understand relative performance across countries and to itself.
- Ratios below 100 (%) or below a country’s historical average generally considered undervalued, suggesting potential investment opportunities
- Ratios above 100 (%) or above a county’s historical average viewed as overvalued, which could signal lower future returns or market correcti
Currently, the US market is at its historic high since 2000 and China is below its historic median since 2000.
Exhibit 1: MC to GDP Ratio (%) - Current and Range 2000-2025

Source: MarketVector, International Monetary Fund (GDP 2025 estimates in USD), World Federation of Exchanges (MarketCap January 2025 in USD), World Economic Forum (HO-LO range 2000-2022). Data as of March 2025.
Usefulness and Limitations
While the Buffett Indicator provides a high-level view of market valuation, it has certain limitations:
- Globalization: diversified companies generate substantial revenues from international operations which may not be reflected in domestic GDP, skewing the ratio for countries with large multinational companies.
- Economic Structure: differences in economic structures and the proportion of publicly listed to private companies can affect the indicator’s trend and comparability.
- Interest Rates: the indicator does not account for interest rates and only considers the value of the stock market, without considering how stocks are valued relative to alternative capital, such as bonds.
Staying invested: Finding Value between Market Extremes
While the US looks expensive, the aggregate World MC/GDP ratio is close to it’s long term average since 2000, indicating that there are other parts of the world that might look cheap. China is one country below it’s average and lower than the rest of the world; india is one country above it’s average and higher than the restor of the world. Comparing BlueStar® China Internet Software Index (BCHNQ) to MVIS® Digital India Index (MVDIND), we can see that BCHNQ has outperformed MVDIND over the last year (since March 16, 2024). This resurgence signals renewed investor interest, placing China back on the opportunity radar as a potential value play in global markets.
Exhibit 2: Cumulative Performance – Last One Year (3/16/2024-3/17/2025)
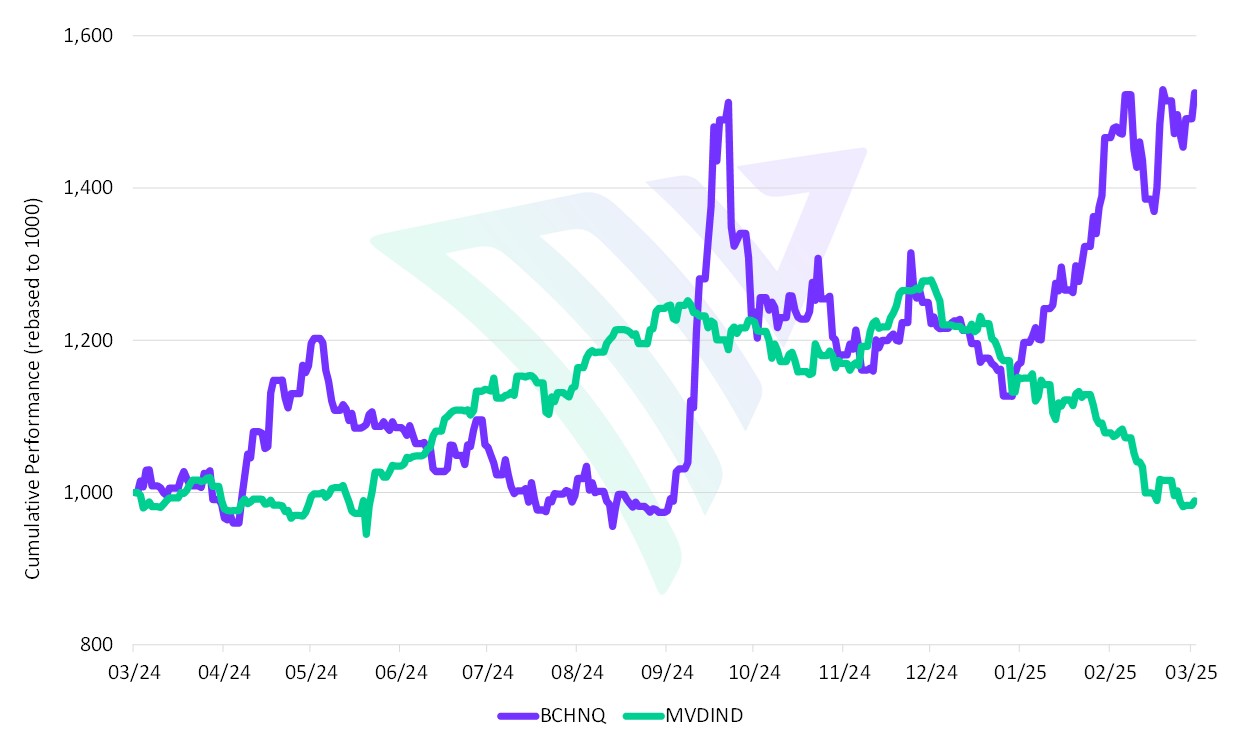
Source: MarketVector. Data as of March 18, 2025.
For more information on MarketVector Indexes, visit www.marketvector.com.
Get the latest news & insights from MarketVector
Get the newsletterRelated:
Most popular
-
.png) Commentary
CommentaryAI Infrastructure